클라우드프로그래밍 14주차 — Prometheus 모니터링과 RBAC 접근 제어
Prometheus로 메트릭을 수집·조회하고, RBAC로 클러스터 자원 접근을 제어한 14주차 기록. 한 학기 클라우드프로그래밍 과정의 마지막 주차다.
마지막 14주차는 두 가지를 다룬다. Prometheus 로 메트릭을 수집·조회하는 것과, RBAC 로 클러스터 자원 접근을 제어하는 것이다. 7주차 클러스터에서 진행했다.
핵심 개념
- Prometheus: 대상의
/metrics엔드포인트를 주기적으로 스크래이프(pull) 해 시계열로 저장하고 PromQL 로 질의한다.up메트릭으로 대상 생존 여부를 확인한다. - RBAC(Role-Based Access Control):
Role/ClusterRole(권한 묶음) +RoleBinding/ClusterRoleBinding(주체↔권한 연결). 최소 권한 원칙 을 따른다.
Prometheus 모니터링
Prometheus 배포 + 타겟/메트릭 확인
자기 자신을 스크래이프하도록 설정한 prometheus.yaml 을 적용했다.
1
2
3
4
5
6
7
8
9
10
11
12
$ kubectl apply -f prometheus.yaml
$ kubectl wait --for=condition=Available deploy/prometheus
deployment.apps/prometheus condition met

$ curl -s localhost:9090/api/v1/targets   # 타겟 상태
job: prometheus | health: up | endpoint: http://localhost:9090/metrics

$ curl -s 'localhost:9090/api/v1/query?query=up'
up{job="prometheus"} = 1                   # 대상 정상(=1)

$ curl -s 'localhost:9090/api/v1/query?query=prometheus_tsdb_head_series'
prometheus_tsdb_head_series = 535          # 수집 중인 시계열 수
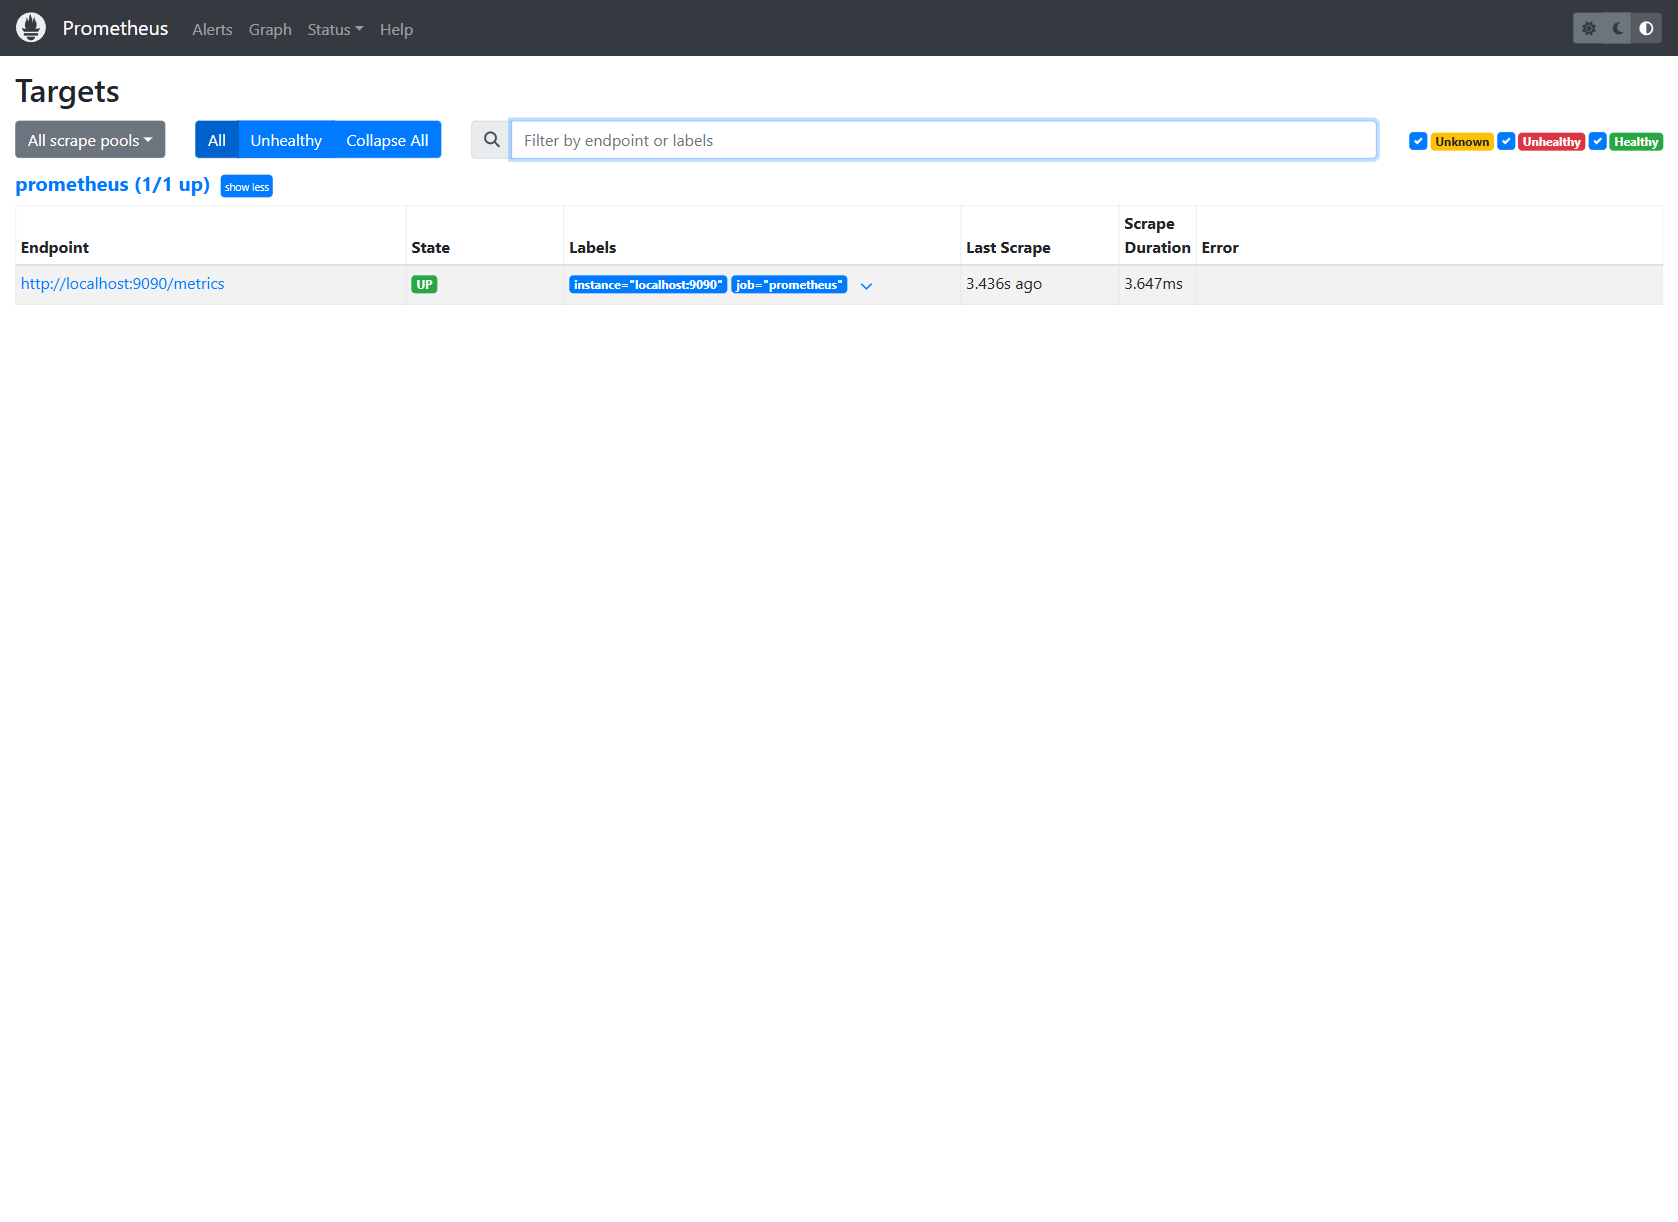
Prometheus 웹 UI — Targets
스크래이프 대상이 UP 상태로 수집 중이다(Last Scrape 3.4s ago).
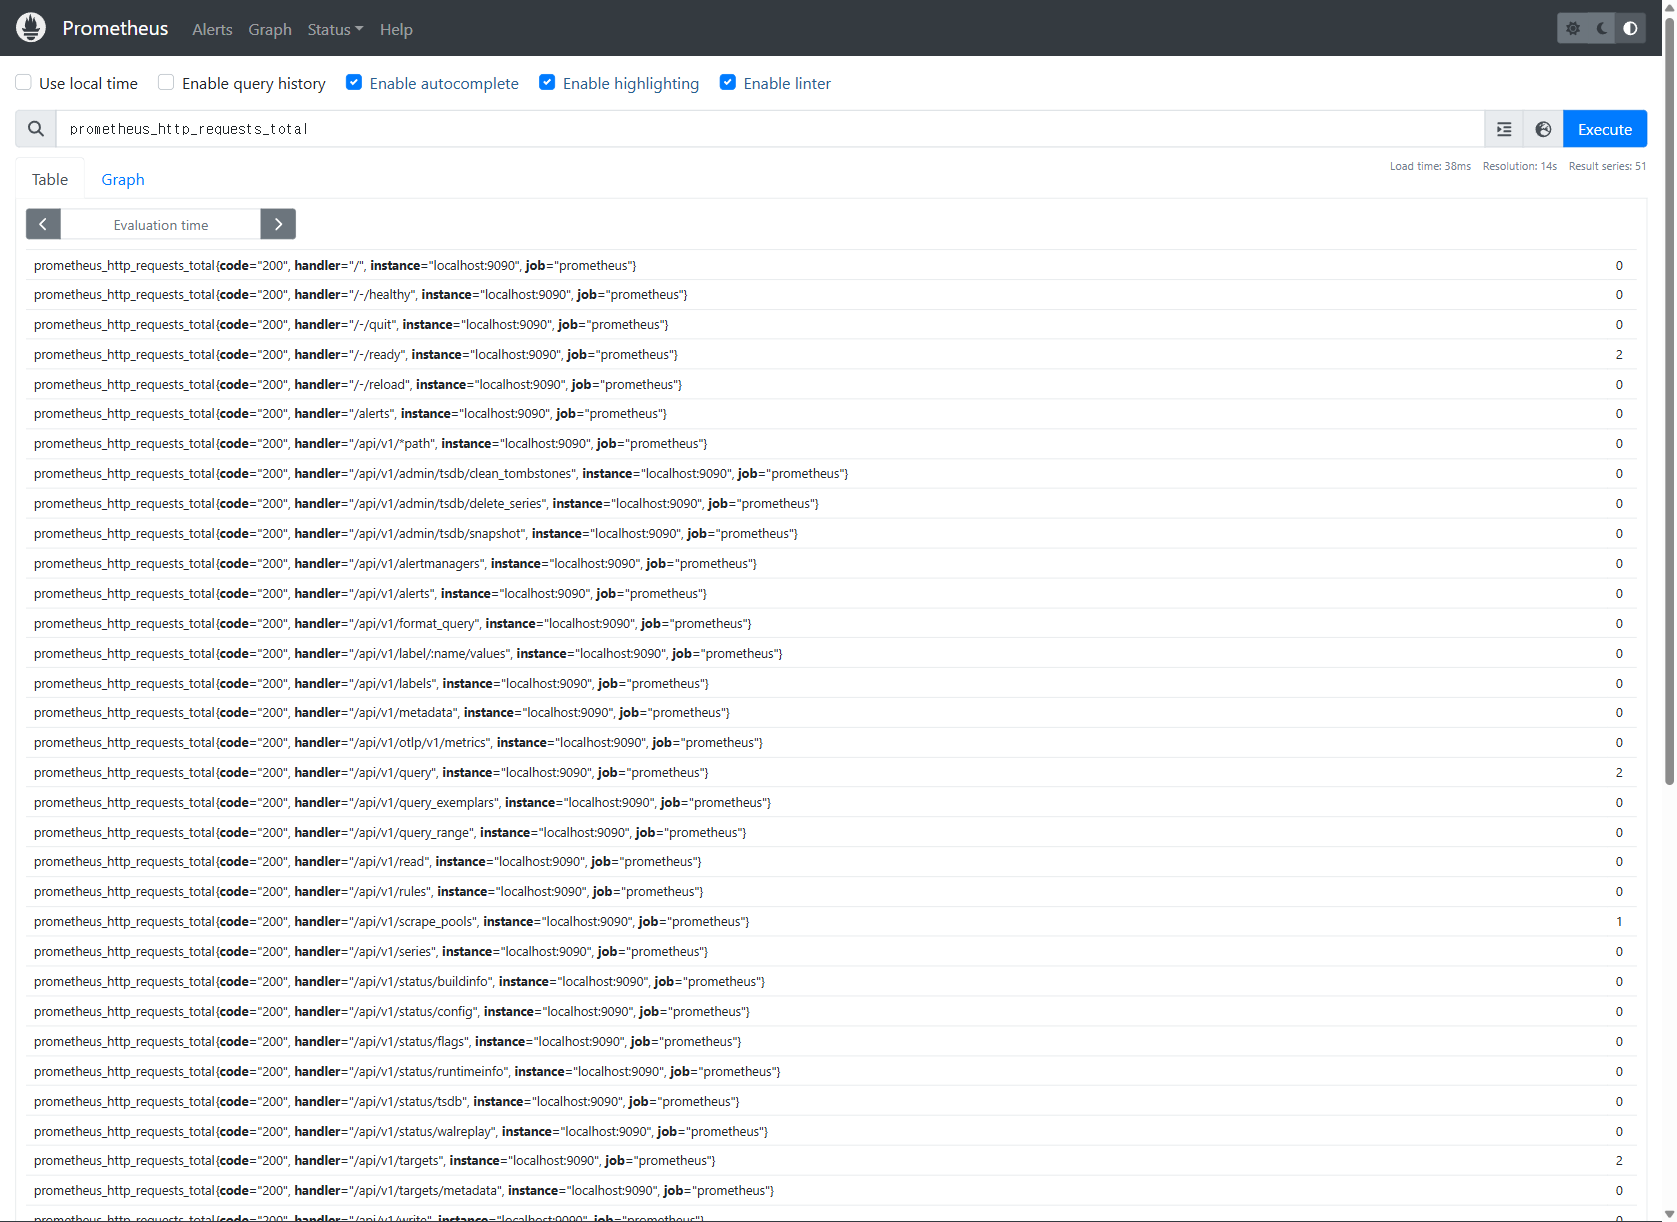
Prometheus 웹 UI — PromQL 질의
prometheus_http_requests_total 을 질의해 핸들러/코드별 카운터를 테이블로 조회했다.
RBAC 접근 제어
ServiceAccount + Role + RoleBinding 생성
1
2
3
$ kubectl create serviceaccount demo-sa
$ kubectl create role pod-reader --verb=get,list --resource=pods
$ kubectl create rolebinding demo-binding --role=pod-reader --serviceaccount=default:demo-sa
demo-sa 는 default 네임스페이스에서 pods 조회(get/list)만 가능하도록 묶었다.
권한 검증 (kubectl auth can-i --as=...)
1
2
3
4
5
6
7
8
9
10
SA=system:serviceaccount:default:demo-sa

$ kubectl auth can-i list pods --as=$SA                    # 부여된 권한
yes
$ kubectl auth can-i delete pods --as=$SA                  # 미부여(get/list만)
no
$ kubectl auth can-i list pods -n kube-system --as=$SA     # Role은 default 한정
no
$ kubectl auth can-i get secrets --as=$SA                  # 미부여 자원
no
부여한 동작·네임스페이스·자원에서만 yes, 그 외에는 모두 no 로, 최소 권한 원칙이 그대로 적용된다.
내장 ClusterRole 확인
1
2
3
4
5
$ kubectl get clusterrole | grep -E '^(view|edit|admin|cluster-admin)'
admin / cluster-admin / edit / view        # 쿠버네티스 기본 제공 롤

$ kubectl describe clusterrole view | grep 'pods'
  pods   []   []   [get list watch]        # view 롤은 읽기(get/list/watch)만 허용
정리
1
2
$ kubectl delete -f prometheus.yaml
$ kubectl delete rolebinding demo-binding; kubectl delete role pod-reader; kubectl delete sa demo-sa
정리
kubectl auth can-i 는 “이 주체가 이 동작을 할 수 있는가”를 즉시 확인하는 방법으로, 1주차에서 다룬 AWS 책임 공유/IAM 개념의 쿠버네티스 구현에 해당한다. Prometheus의 up 메트릭은 6주차 Docker 헬스체크, 11주차 사이드카(메트릭 노출)와 같은 맥락의 관측 지점이다.
한 학기 과정을 돌아보면 클라우드 개념(1) → 네트워크(3) → Docker 컨테이너·레지스트리·볼륨·Compose(4~6) → 쿠버네티스 클러스터·파드·Helm·구성·로깅·모니터링·보안(7~14)으로 이어졌다. 가상 서버 한 대에서 시작해 자가복구·관측·접근 제어까지 다루는 흐름으로 구성된 과정이었다.